


PaperBanana
Turn text descriptions of research into polished, publication-ready scientific figures with a multi-agent AI pipeline.
What is PaperBanana?
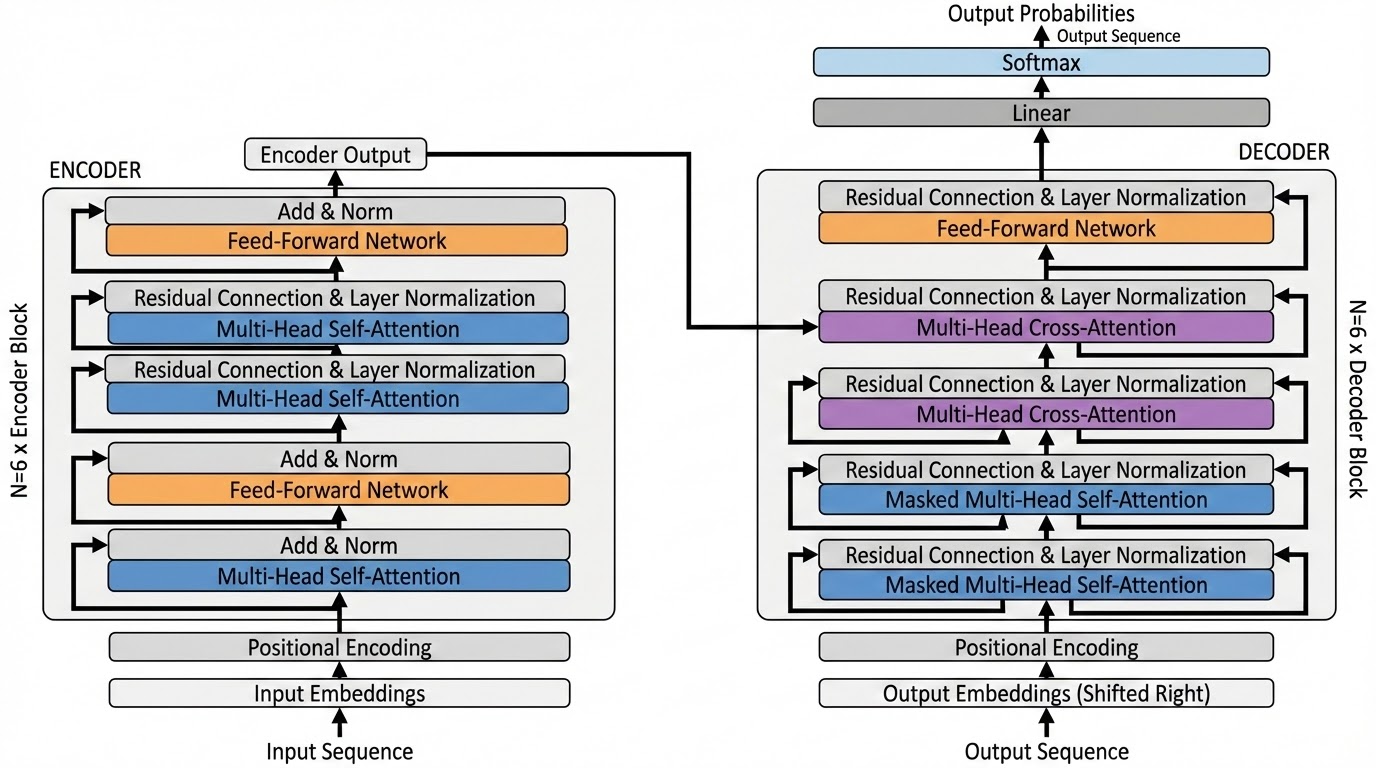
PaperBanana is an AI-powered academic illustration generator built for researchers who need publication-ready figures without hand-drawing every detail. It converts text descriptions of papers into methodology diagrams, statistical charts, system architectures, flow charts, and poster assets through a multi-agent collaboration pipeline. Instead of offering simple image generation, the tool coordinates planning and visualization agents to produce logically accurate scientific graphics. At the core of PaperBanana is a closed-loop five-agent architecture. A Planner agent turns textual descriptions into structured visual layouts, while a Visualizer agent renders them with the built-in Nano-Banana-Pro model using precise shapes, connectors, and scientific icons. For statistical plots, PaperBanana generates executable Python Matplotlib code from raw data rather than rendering pixels, which keeps bars, axes, and scales mathematically precise and avoids numerical hallucination. Researchers can also upload rough sketches or whiteboard notes and let the framework apply auto-summarized aesthetic guidelines to refine color, typography, spacing, and overall quality. PaperBanana is trusted by researchers from institutions such as Stanford, UC Berkeley, CMU, Tsinghua, and SNU. The service offers several credit-based plans with annual image allowances, support for 1K, 2K, and 4K resolutions, and an editing workflow that uses GPT Image 2.5 to change labels, colors, and details while preserving the original figure. It is designed for scientists, students, and authors who want polished figures for top-venue papers, tutorials, lecture slides, and supplementary materials.
SpecificationsAI-estimated
Key Features of PaperBanana
Use Cases for PaperBanana
Creating methodology diagrams
Describe your model architecture or algorithm flow and get a structured visual layout suitable for top-venue papers.
Generating statistical plots
Provide raw data and receive executable Matplotlib-based charts with mathematically precise bars, axes, and scales.
Designing system architectures
Explain components and their connections to produce clear system pipeline and framework illustrations.
Making educational infographics
Turn science concepts into readable diagrams for lecture slides, tutorials, and supplementary materials.
Polishing rough sketches
Upload a whiteboard sketch or hand-drawn draft and have it refined into a publication-quality figure.
Building poster assets
Generate visual assets for conference posters and research presentations directly from text prompts.
Illustrating paper concepts
Paste relevant paper text and let the planner agent turn it into coherent visual figures for publication.
How to use PaperBanana?
Describe your figure
Enter a text description of the academic figure you want, such as a methodology diagram, statistical chart, or system architecture.
Customize the output settings
Select the visual style, model, aspect ratio, quality, format, and image text language from the available options.
Generate the image
Confirm your prompt and pay the required credits to let the multi-agent pipeline generate the figure.
Edit and refine
Use GPT Image 2.5 to change labels, colors, and details while preserving the original figure structure.
Download the result
Download the finalized figure in your chosen format. Advanced plans allow unlimited image downloads.
Pros & Cons of PaperBanana
Pros
- Produces publication-ready figures directly from natural language text
- Uses code-based Matplotlib generation for mathematically accurate statistical charts
- Refines rough sketches with auto-summarized aesthetic guidelines
- Supports multiple diagram types including methodology diagrams, system architectures, flow charts, and posters
- Ofers fast multi-agent workflow that does not require manual drawing skills
Cons
- Credit-based pricing can become costly for high-volume generation
- Advanced features such as fast response and unlimited dimensions require higher-tier paid plans
- Generated figures may still need careful review for exact scientific accuracy before submission
- No explicit free tier or local installation option is described
Frequently Asked Questions
What is PaperBanana?
PaperBanana is an AI-powered academic illustration generator that transforms paper text into publication-ready methodology diagrams, statistical charts, and other scientific figures through a multi-agent collaboration pipeline.
How does PaperBanana generate figures?
PaperBanana uses a closed-loop five-agent architecture. A Planner agent translates text into structured layouts, and a Visualizer agent renders them using the built-in Nano-Banana-Pro model with precise shapes, connectors, and scientific icons.
What types of figures can PaperBanana create?
It supports methodology diagrams, statistical charts, system architectures, flow charts, poster assets, and educational infographics.
How are statistical charts made more accurate?
Instead of rendering charts as pixels, PaperBanana generates executable Python Matplotlib code from raw data. This ensures that bars, data points, axes, and scales are mathematically precise and avoids numerical hallucination.
Can I edit images after they are generated?
Yes. PaperBanana offers editing with GPT Image 2.5, allowing you to change labels, colors, and details while keeping the original figure intact.
Can I upload my own sketches for refinement?
Yes. PaperBanana can transform rough hand-drawn sketches or simple whiteboard notes into professional-grade illustrations using auto-summarized aesthetic guidelines.
What pricing plans are available?
PaperBanana offers a Hobby plan and advanced plans. The Hobby plan includes about 720-1,440 images per year with 7,200 credits, while advanced plans include more credits, fast response, priority support, and features like uploading reference images and intelligent aesthetic refinement.
Can I try PaperBanana before paying?
The website includes an interactive generation area where you can enter a text description and see a figure generated in seconds. Credit costs apply per generation, and higher plans include more credits and features.
Reviews & Ratings0.0
No reviews yet. Be the first to write one!
Top Alternatives & Similar Software
View all alternatives & similar software→No alternatives available yet.
People also viewed


Related searches
Is this your tool?
Claim this page to update details, reply to user reviews, and drive more traffic to your product.
Claim this Product →
Tags
Keep up with PaperBanana alternatives
New alternatives, pricing changes and the week's biggest movers - one email every Tuesday.