


kepler.gl vs Ultimaps
Side-by-side comparison of features, pricing, ratings, and alternatives.

Kepler.gl is a powerful open source geospatial analysis tool for large-scale data sets. It allows users to visualize and explore geospatial data in a highly interactive and customizable way, enabling them to gain insights and make data-driven decisions.
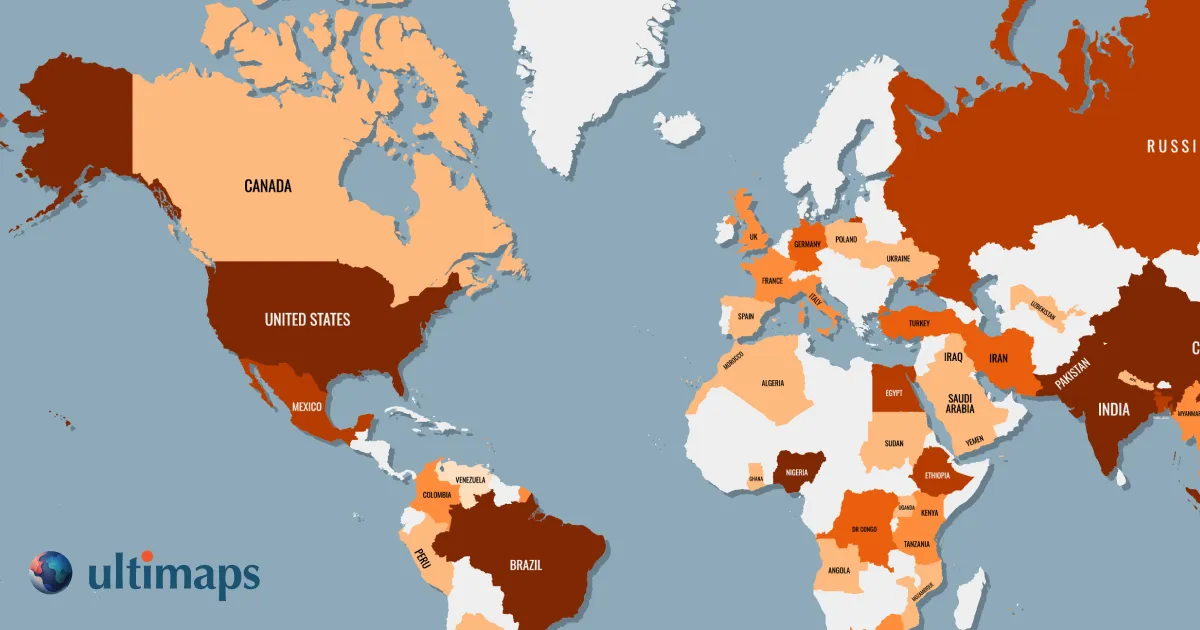
Ultimaps is a browser-based map visualization tool that lets users turn spreadsheet data into beautiful color-coded maps, export high-resolution PNG/SVG/PDF files, or embed interactive maps on websites without writing code.
- Highly interactive and customizable visualization options
- Supports large-scale geospatial data sets
- Real-time data updates and collaborative environment
- Open source and free to use
- Very easy to create maps without GIS or design skills
- Directly imports data from Excel, CSV, Google Sheets, and Notion
- Generous free tier with no sign-up required to start
- Interactive map embeds with tooltips, popups, and click-through links
- Steep learning curve for non-technical users
- Limited support for non-geospatial data types
- Dependent on data quality and formatting
- Free exports include attribution and are standard resolution only
- Attribution-free and vector exports require Pro subscription
- Not a street-level map tool, more of a regional data visualization tool
- Custom maps and advanced features cost extra
More alternatives & similar tools
Alternatives to kepler.gl
View all →


Alternatives to Ultimaps
View all →

The Verdict
AI-generated from listing dataUltimaps offers a low‑effort, no‑code way to create interactive regional maps with a paid tier, while kepler.gl is a free, open‑source platform for technical users needing large‑scale, highly customizable geospatial analysis.
Key differences
- •Ultimaps focuses on easy, no‑code map creation from spreadsheet‑style data; kepler.gl requires coding knowledge and handles millions of points.
- •Ultimaps provides a paid subscription for high‑resolution exports and AI features; kepler.gl is completely free and open source.
- •Ultimaps targets sales, real‑estate, and teaching audiences with simple visual needs; kepler.gl targets data analysts and urban planners needing deep analysis.
- •Export options differ: Ultimaps offers PNG/SVG/PDF exports; kepler.gl does not list export formats in the facts.
- •Collaboration and real‑time updates are built into kepler.gl; Ultimaps does not mention collaborative features.
Pricing & value
kepler.gl is free; Ultimaps requires €49/month for Pro features.
Ease of use / learning curve
Ultimaps is no‑code and easy for non‑technical users; kepler.gl has a steep learning curve.
Features & depth
kepler.gl supports millions of points, real‑time updates, and extensive analysis; Ultimaps is limited to regional visualizations.
Integrations & ecosystem
Ultimaps directly imports Excel, CSV, Google Sheets, Notion; kepler.gl only lists generic data formats.
Collaboration
kepler.gl mentions real‑time updates and collaborative environment; Ultimaps has no collaboration features noted.
Scalability
kepler.gl handles large‑scale datasets; Ultimaps limited to 5,000 geocodings per month on Pro.
Support
Ultimaps offers paid custom plans and Pro support; kepler.gl only provides email and GitHub Issues.
Choose kepler.gl if…
Technical analysts needing free, high‑performance, customizable geospatial analysis of large datasets.
Choose Ultimaps if…
Non‑technical users who need quick, attractive regional maps from spreadsheet data.
Common questions
What is the cost to get high‑resolution map exports?
Ultimaps requires a Pro subscription (€49/month); kepler.gl offers all features for free.
Can I create maps without coding?
Yes, Ultimaps is no‑code; kepler.gl requires technical knowledge and has a steep learning curve.
Which tool handles millions of data points?
kepler.gl supports large‑scale datasets with millions of points; Ultimaps is limited to 5,000 geocoding requests per month on Pro.